Measuring Emotion in Retail
THE PROJECT
As user experience professionals, we wanted deeper insight into how our participants are feeling so that we could provide more meaningful design recommendations. Traditionally in research, feelings have been inferred from spoken words and self-report survey results, but we sought out to see if we could understand a more comprehensive picture.
We ran a study collecting qualitative feedback along with biometric data to investigate if this additional layer tells the same story or if it provides a deeper behavioral and emotional perspective. This project took place at the Bentley User Experience Center with one senior staff member, and I assumed the lead role, operating the study and conducting collaborative analysis.
THE PROCESS
We chose to use virtual dressing rooms as the stimuli for our study because websites with this feature involve new and interesting technology, complex usability, and emotional components (e.g. body image and data privacy). I found three different virtual dressing rooms Metail.com, Glamstorm.com, and VirtualOutfits.com and used these websites to analyze their individual emotional engagement and to evaluate how these virtual experiences varied compared to each other. Each website involved the same general setup, where users visit the website to search for clothing items for purchase and virtually try on selected clothing items using a customizable virtual model.

Metail

Virtual Outfits

Glamstorm
During the study, these models were personalized with body measurements, skin color, hair style, hair color, and face makeup. This personalization was completed in a similar manner but involved some process differences. We considered how users interacted with each of the websites, how the models were presented to users, and how the models were edited by users.

Metail - Edit

Virtual Outfits - Edit

Glamstorm - Edit
Study Details
This study was run in-person with ten participants (females only) at the Bentley User Experience Center. We only ran sessions with females because the websites were geared specifically towards women. The usability tests consisted of background questions, one scenario for each of the three websites, and a post-session interview and survey. The scenario presented to each participant was to find a dress to wear to a friend’s wedding. Throughout the test, we collected qualitative data through verbatim comments and self-report survey answers along with biometric data including facial expressions, eye tracking, and shimmer peak detection or galvanic skin response (GSR).
Snippet from Moderator’s Guide.
Lead for Study Operation
I assumed lead and operated the study, running all of the details from start to finish by developing the moderator’s guide, conducting the recruit, and moderating all 10 usability sessions. To recruit participants, I developed a survey in Qualtrics that was posted on Craiglist and managed communications by sending confirmation and reminder emails. I also operated the lab technology and biometric tools on my own.
While we documented various usability problems, such as issues with filters and editing the model, our study wasn't concerned with usability. We investigated how biometrics may or may not play a role in understanding feelings and what kind of value this different lens can bring to enhance our behavioral and emotional understanding. We wanted to investigate how we can analyze emotion within user experience and how this measurement can fit into and expand upon our current research methods.
Goals:
Gain deeper insight into the emotional user experience
Understand the value of biometric data, beyond traditional user research methods
Develop best practices for collecting and analyzing biometric data
Qualitative Analysis:
Once our usability test sessions were complete, we ran a qualitative analysis with two different data sources including the positive and negative comments that people said aloud and the answers from the self-report post-session survey. Our results did not reach significance, but the data from both sources suggested that the Metail website might have performed better than the other two websites.

Comments
We conducted a frequency count of the positive and negative comments for each participant across the three websites from the perspectives of overall, introduction, edit, try, and other. While we heard a range of comments, both positive and negative, we didn’t see a clear pattern of results. Overall, we found from this count that perhaps Metail performed the best because there were a slightly higher amount of positive comments and a lower amount of negative comments compared to the other two websites.

Self-Report Survey
We also analyzed the results of our self-report post-session survey in Qualtrics. While we saw small differences across the three websites, we again saw no clear pattern in these qualitative results. Our impression is that perhaps Metail is the best of the websites because it had a higher overall average within the survey results, but the average numbers from the survey weren’t very high in general, leading us to believe that overall people weren’t big fans any of the sites.

Sample question from Qualtrics survey
Quantitative Analysis:
Next, we analyzed our biometric data for facial expressions, eye tracking, and galvanic skin response (GSR) from the perspectives of overall and specific slices, including introduction, edit, and try.
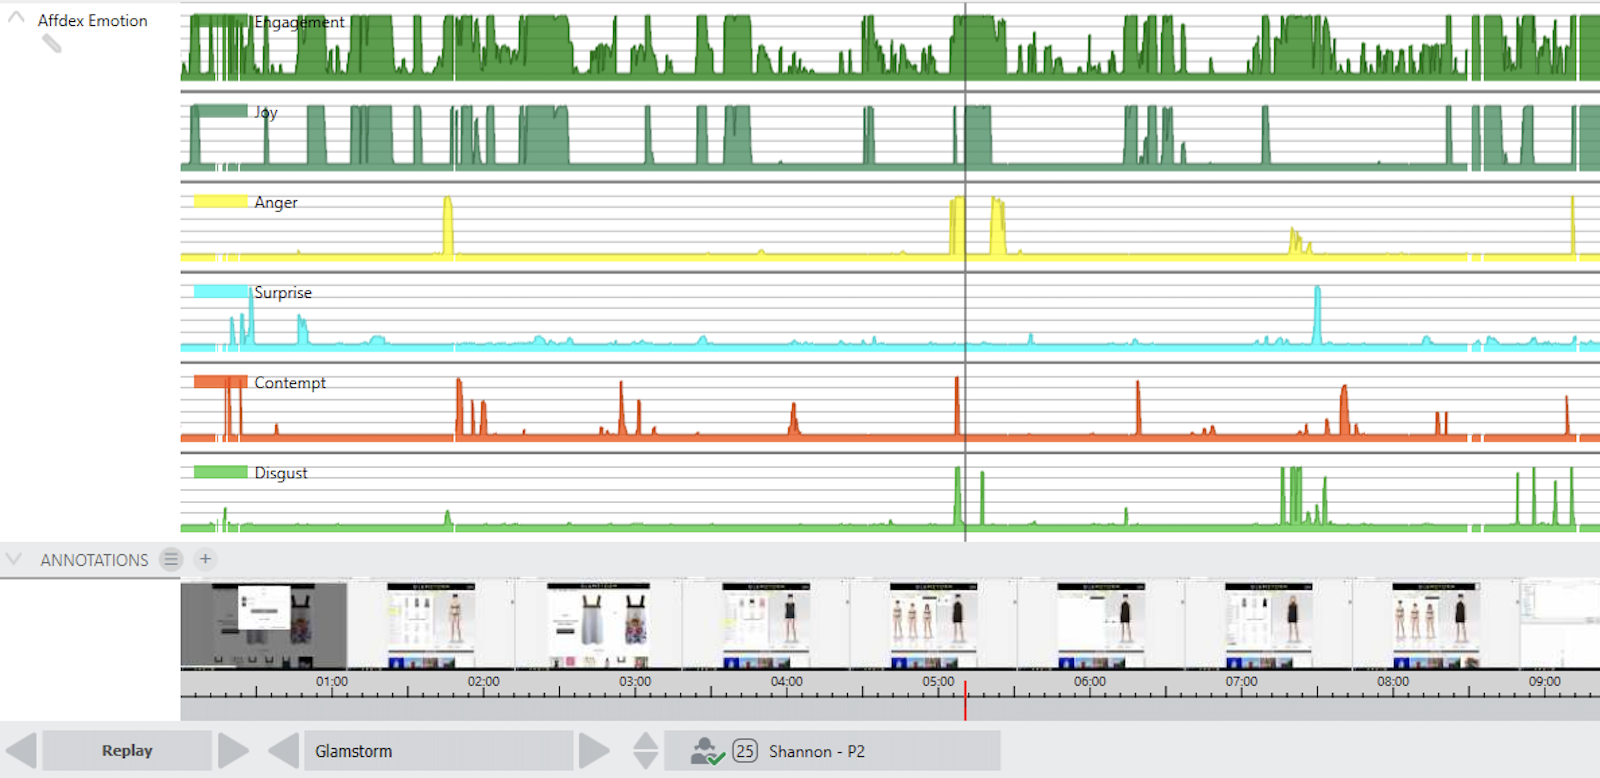
Facial Expression Analysis
We used the iMotions software to look at peaks for different emotions in terms of how long they were peaked and where the peaks happened. Overall we found that the emotions of sadness, anger, and fear were basically non-existent in our study. We found there was overall higher positive, engagement, attention, joy, disgust, and contempt in Glamstorm and Virtual Outfits compared to Metail. These statistically significant findings contradict the trend observed in the qualitative results.

Biometric display of the Facial Expression Analysis in iMotions

With the facial expression analysis, we wanted to aggregate the emotions and see from a big picture if there was a valence between the three sites. We looked at the positive emotions of joy and surprise and negative emotions of disgust, contempt, anger, sadness, and fear. In our study, the drive for positive was mostly joy, and the drive for negative was mostly disgust and contempt. The surprising thing here was that Metail seemed to be trending better from the verbatim and the survey but had less positive emotions associated with it compared to Glamstorm and Virtual Outfits.

We also wanted to look at the biometric results through engagement and attention. Engagement represented when there was some kind of reaction occurring, and attention was captured when the user was focused on the screen, and these told us that participants were looking at the website and involved with what was going on. As depicted in the chart, Glamstorm and Virtual Outfits had more engagement and attention than Metail.

Next we looked at joy. Joy is related to smile, and the percentage of time smiling was significantly less in Metail, as there was higher joy in Glamstorm and Virtual Outfits.
Overall, we found higher disgust in Glamstorm and Virtual Outfits compared to Metail. The difference between disgust and contempt can be subtle. Facial expressions are a little different for each but they’re related constructs. Disgust is often associated with things, such as disgust with spoiled milk, and is often accompanied by a noise wrinkle, while contempt is often associated with people and is accompanied by a chin raise. It is unclear with this virtual dressing room technology which is expected to be felt because these websites displaying models are neither people or things, so we saw noise wrinkles and chin raises. Sometimes we saw overlap in the emotions but nonetheless these were negative emotions we wanted to look at.
After we looked at the biometric data from an overall perspective, we looked at it in segments. The introduction slice captured the first 10 seconds each participant looked at the model. The edit slice captured the whole time participants edited the model to match themselves. The try slice captured the time participants searched for clothing and viewed them on the model. We saw Glamstorm and Virtual Outfits were clearly consistent and higher performers in each aspect of the experience. This finding may not indicate that people did not like the Metail website, but it shows that this website was not as engaging as the other two websites.
Eye Tracking
When using eye tracking for our study, we could see where participants were looking but we couldn’t infer any kind of emotion. We used eye tracking to help us diagnose what may have triggered the participant to experience a particular emotion. We would like to explore how we can use eye tracking in conjunction with the facial analysis more in the future.
Galvanic Skin Response (GSR)
GSR measures the skin conductivity and micro amounts of sweat on the skin which are correlated to having relatively higher moments of arousal or excitement. Our GSR biometric data provided inconclusive results. We did not collect quality readings for 2 of the 10 participants, so we had a data sample size of 8 for analysis. This sample did not show anything of interest in this project, however we would like to investigate this biometric data source further in the future.

OUTCOME
There were quite different results when we analyzed the biometric data compared to the qualitative data. In the qualitative data, we saw that the three websites were largely similar in their behavioral and emotional experiences, with Metail performing slightly better than the other two websites.
The results from the biometric data told another story. While there was not a great difference in results between Glamstorm and Virtual Outfits, Metail clearly did not evoke as much engagement as the other two websites. We then started questioning what it was about Glamstorm and Virtual Outfits that was more engaging than Metail that hadn’t surfaced in the qualitative data. Perhaps it was the clothing items available for try on and purchase, the appearance of the model’s body, surplus features incorporated into the virtual experience (e.g. the model walking down a runway), or the level of customization available (e.g. applying makeup to the models face, selecting hair styles, etc.).
Biometric data offers new insight into user emotions that is not easily understood by looking at a study more traditionally. The possibility of bringing this technology into the user experience research toolkit is exciting, enabling a deeper understanding of users and fostering more meaningful design recommendations.
CHALLENGES
Biometric data has the potential to provide powerful insights, however there are challenges involved. One area to consider when collecting this kind of information is the effect the moderator can have on the data collected. Like traditional research methods, moderators can have unintended influence on participants and cause extraneous emotions during conversation that is unrelated to the website or the product being tested. iMotions instructs their software users not to speak at all during biometric recordings, but this is tricky when using this technology with usability testing. More research is needed to understand the implications and tradeoffs in data quality when making decision on how best to use the software.
It is also difficult to account for participants’ mental state at the time they begin the usability test. It is important to consider the emotional experience related to their interaction with the website or product, as well as outside factors unrelated to the test that may influence results. Another area for consideration involves how emotion is expressed differently across people based on various factors, such as culture, age, and gender and how this can affect results.